CPU
Record traces while reproducing stutter. Inspect call stacks and frame deadlines to see whether work belongs on a background executor.

Diagnostics
Android Studio ships profilers and inspectors that understand activities, fragments, and Jetpack lifecycles. Use this page as a map from symptoms to the right tool window.
CPU profiling highlights hot methods and scheduling issues. Memory profiling tracks allocations and retention paths. Network and energy views connect background work to user visible jank and battery drain.
Record traces while reproducing stutter. Inspect call stacks and frame deadlines to see whether work belongs on a background executor.
Heap dumps and allocation timelines expose leaked contexts, oversized bitmaps, and caches that never evict.
Correlate wake locks, location requests, and alarms with foreground states to prioritize fixes that move metrics.
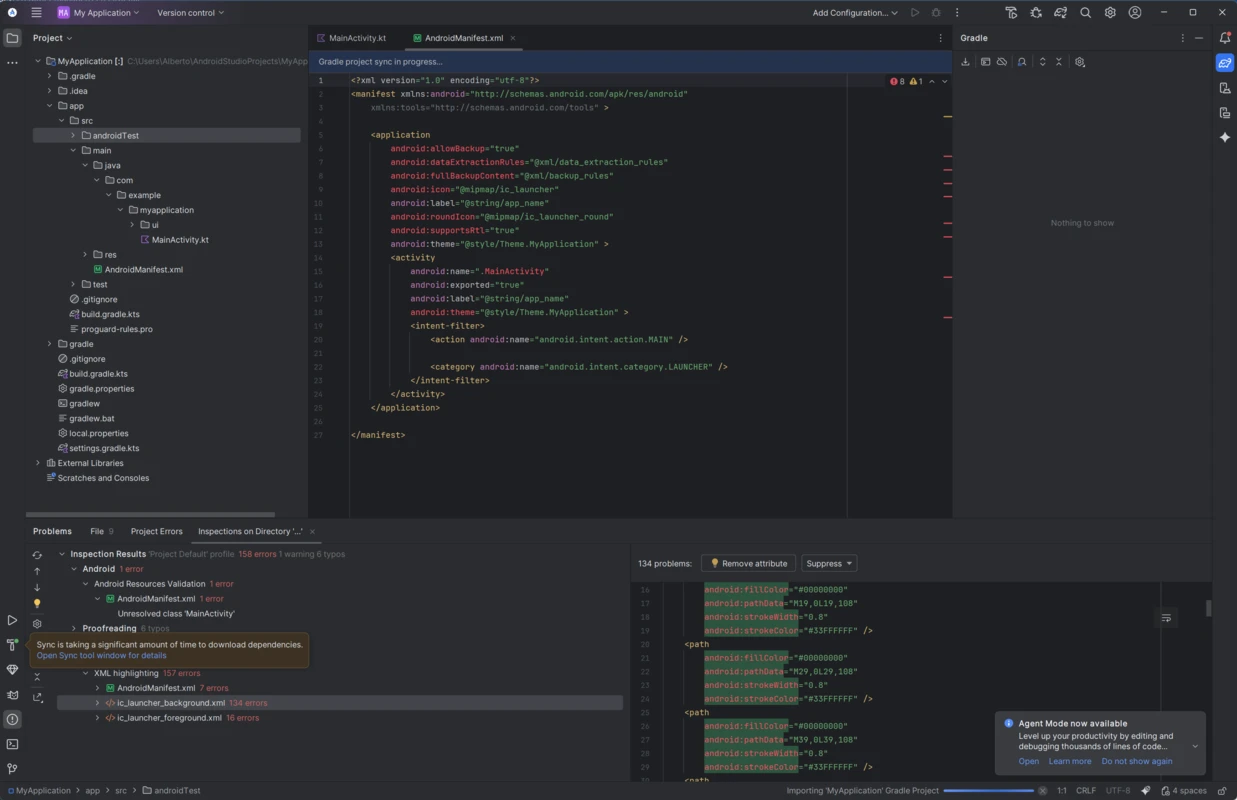
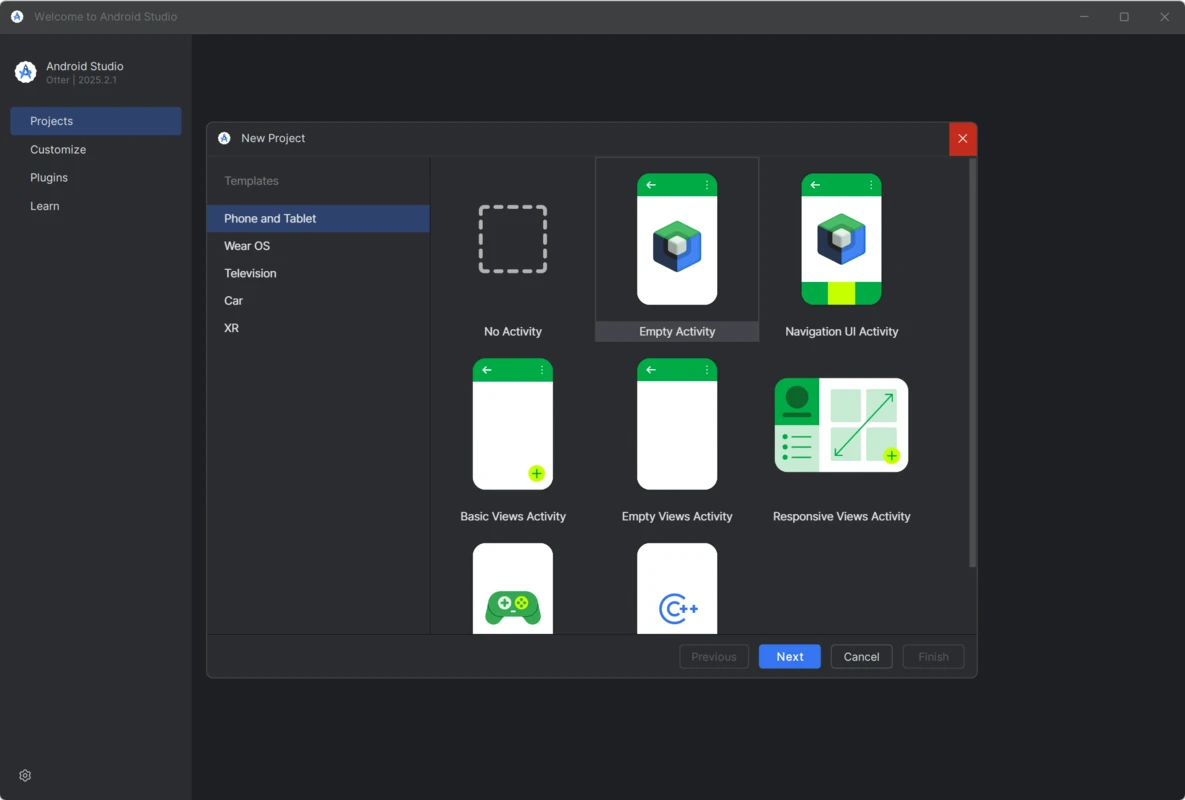
Structured filters help you isolate your package, severity levels, and tags. Save filter sets per feature team so on call rotations start from the same baseline.
Layout inspector visualizes view hierarchies and recomposition counts for Compose. Database inspector reads Room databases during development when enabled for debug builds.
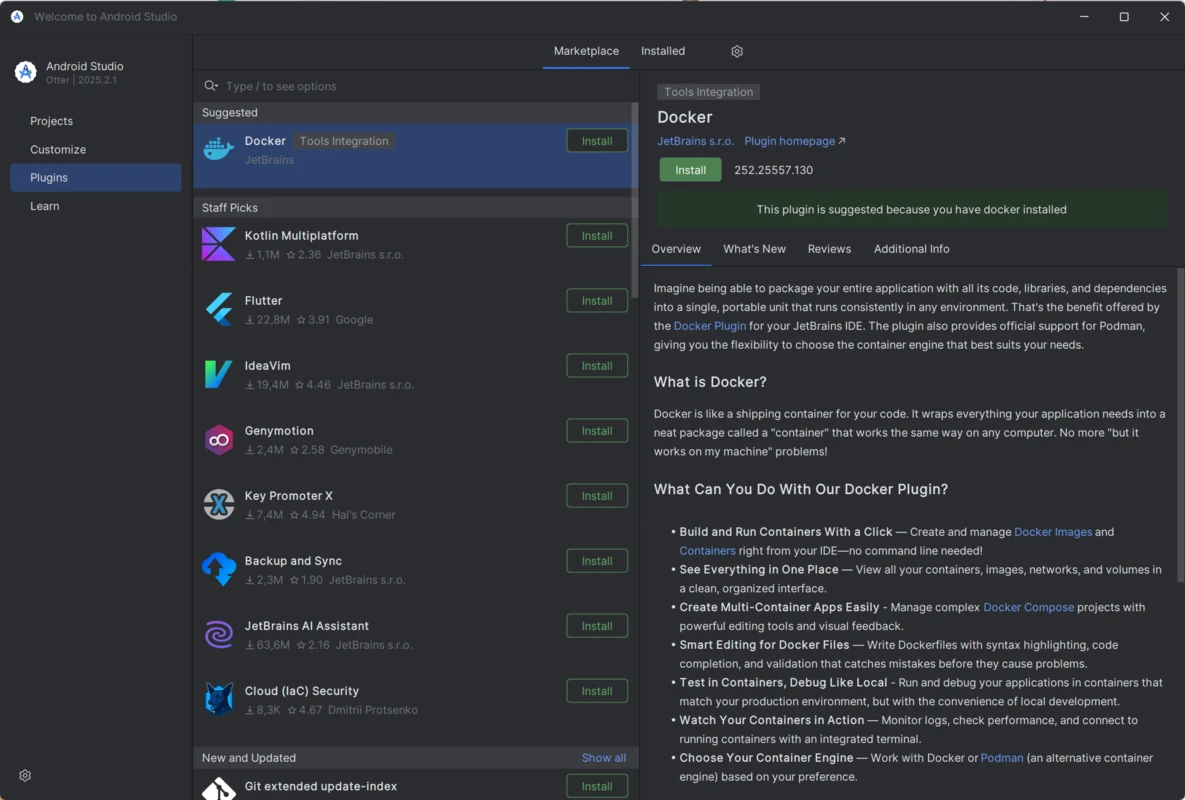
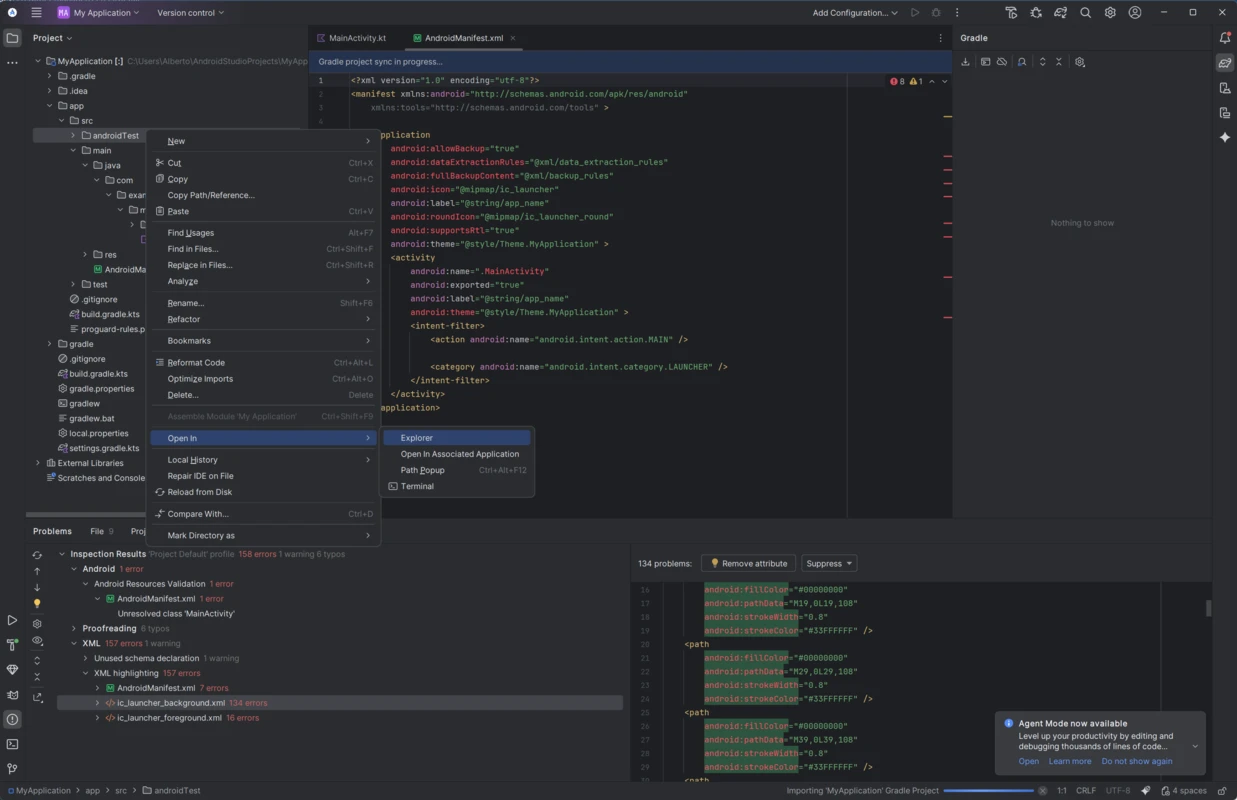
Images are from the local media folder and illustrate typical dense tool layouts.